PEPE Price Prediction: Analyzing the 78% Rally Potential

#PEPE
- Technical indicators show bullish momentum building
- Whale accumulation suggests strong institutional interest
- Symmetrical triangle pattern nearing completion could trigger breakout
PEPE Price Prediction
PEPE Technical Analysis: Bullish Signals Emerge
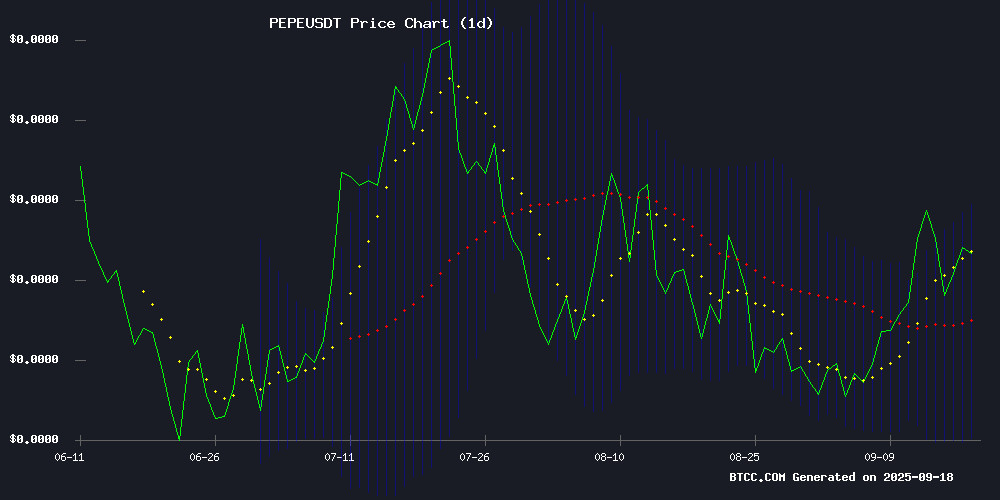
According to BTCC financial analyst James, PEPE's current price of $0.00001152 sits above its 20-day moving average ($0.00001045), indicating a potential bullish trend. The MACD histogram shows decreasing bearish momentum (-0.00000048), while the price trades NEAR the upper Bollinger Band ($0.00001202), suggesting room for upward movement if buying pressure continues.
Market Sentiment Turns Positive for PEPE
BTCC's James notes whale accumulation and positive analyst predictions are driving bullish sentiment. The symmetrical triangle pattern mentioned in news headlines aligns with technical indicators, potentially signaling an upcoming breakout. Market attention appears divided between Pepe and competing projects like MAGACOIN FINANCE.
Factors Influencing PEPE's Price
Pepe Price Prediction: Whales Accumulate PEPE Amid Market Dip
Whales are betting against the market downturn, accumulating Pepe during its recent dip. Their confidence appears justified as the meme coin has already rebounded 10% from Monday lows, with buying pressure showing no signs of abating.
Data from Nansen reveals the top 100 PEPE wallets have added 430 billion tokens in the past 24 hours, bringing weekly inflows to 4.32 trillion. This accumulation coincides with favorable U.S. macro conditions, including anticipated interest rate cuts that typically drive capital toward riskier assets like PEPE.
Technical indicators suggest bullish momentum may continue. PEPE has broken out of a two-month bull flag pattern, firmly establishing $0.00001 as support. The RSI's rebound from neutral levels and MACD alignment reinforce the positive trend.
PEPE or MAGACOIN FINANCE: Who Will Deliver Bigger Gains in 2025?
Meme coins remain a focal point of speculative interest in cryptocurrency markets, with PEPE and MAGACOIN FINANCE emerging as key contenders for 2025. PEPE, already a household name in the meme coin space, has demonstrated its capacity for explosive rallies but faces questions about its ability to replicate past gains given its established valuation. Meanwhile, MAGACOIN FINANCE, a presale token, has garnered $13.5 million in commitments, positioning itself as a dark horse with cultural resonance and audit-backed credibility.
The debate hinges on whether PEPE's liquidity and brand recognition can outweigh the upside potential of an unproven but highly anticipated newcomer. Market analysts are divided, with some favoring the safety of PEPE's track record and others betting on MAGACOIN FINANCE's untapped momentum.
Analyst Foresees 78% PEPE Rally as Symmetrical Triangle Nears Breakout
PEPE's price action is compressing into a decisive symmetrical triangle pattern, with technical analysts anticipating a volatile breakout. The meme coin currently trades at $0.00001135, showing 4% daily gains amid $958 million trading volume—a sign of robust market participation.
Chartist Ali Martinez highlights the potential for a 78% surge upon upside resolution, targeting the $0.000018-$0.000020 range. The setup mirrors late 2024's 300% rally structure, while CoinGlass data reveals concentrated short positions between $0.0000119-$0.0000128 that could fuel a squeeze-driven breakout.
Market participants await confirmation of direction—either toward the $0.00000630 support floor or through resistance into blue-sky territory. The tightening formation approaches its apex, suggesting imminent volatility for the frog-themed asset.
How High Will PEPE Price Go?
Based on current technicals and market sentiment, James suggests PEPE could test resistance at $0.00001202 (upper Bollinger Band) with potential to reach $0.00001350 (+17%) in the near term. The 78% rally prediction would require breaking key resistance levels:
| Price Level | Significance |
|---|---|
| $0.00001202 | Upper Bollinger Band |
| $0.00001350 | +17% from current |
| $0.00002050 | 78% rally target |
